Virginia's Data Center Boom: Hidden Signals for Insurers in Permit Data
Loudoun County, Virginia, stands as the undisputed global epicenter of the digital economy. It is home to the world's densest concentration of data centers, the physical backbone of the cloud, processing an estimated 70% of the world's internet traffic. For the property and casualty insurance industry, this unprecedented construction boom presents a landscape of seemingly obvious risk and opportunity: new, high-value commercial properties to underwrite, complex construction projects to insure, and a burgeoning local economy. These are the surface risks - visible, quantifiable, and familiar. The most significant exposures, however, are not located within the newly built server farms. They are accumulating silently within the surrounding residential and commercial portfolios that insurers already have on their books. While insurers see the surface risk, building permits reveal the hidden signals. The conventional view of a building permit is that of a lagging administrative artifact, a historical record useful for post-loss analysis or verifying property characteristics. This perspective is dangerously outdated. In a rapidly changing risk environment like Northern Virginia, building permit data, when properly aggregated and analyzed, becomes the earliest possible warning system. It is a real-time feed of ground-truth data that signals profound shifts in risk years before those shifts materialize in an insurer's claims history. This report will demonstrate how permit-based analytics transform this underutilized data source into a powerful leading indicator of future loss, using Virginia’s data center boom as a live case study.
The new risk environment: systemic stress and latent exposure
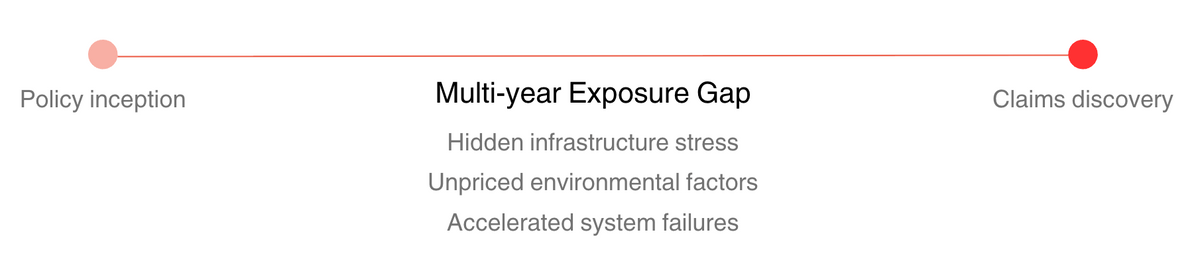
Virginia’s rise as the world’s data center hub is rooted in a unique mix of infrastructure, economics, and proximity to federal agencies. This concentration, however, has created a new class of systemic risk that traditional underwriting models are ill-equipped to measure. The effects of this industrial-scale development ripple outward, imposing immense strain on the regional power grid, accelerating wear on public and private infrastructure, and generating persistent community concerns over environmental impact. These are not isolated incidents but symptoms of a fundamental transformation of the local risk environment. The most critical challenge for insurers is the timeline of this transformation. The risk does not begin when a data center becomes operational; it is seeded the moment the first construction permit is filed, often years before a facility is commissioned or a loss occurs. This creates a multi-year "Exposure Gap" - a period during which insurers are carrying accumulating, unpriced risk without any visibility. Chart 1: Multi-year Exposure Gap
 Consider a standard underwriting workflow. A homeowners policy in Loudoun County renewed in 2022 is priced based on loss data from 2017-2021. If, in 2022, a permit is filed for a new data center campus one mile away, this event is entirely invisible to the pricing model. From 2022 to 2025, construction and the necessary utility upgrades place immense stress on the surrounding area, degrading the home's electrical and HVAC systems. The risk profile of that property has materially changed, but its premium has not. When a major electrical fire or system failure occurs in 2026, it appears to the carrier as a random, attritional loss. In reality, it was a predictable outcome of the permit activity from four years prior. Closing this Exposure Gap requires a new source of intelligence. Builty provides this by transforming raw permit data into actionable risk signals. The foundation of this capability is a proprietary, normalized database built from over 2,000 fragmented, inconsistent, and often archaic municipal sources. This complex data engineering feat creates a clean, standardized, and comprehensive view of construction and system modification activity, making predictive analysis at scale possible for the first time.
Re-framing permit intelligence: from property history to predictive insight
The insurance industry has long used permit data, but in a capacity that is fundamentally reactive and limited in scope. Traditionally, a permit search is conducted to answer a specific question about a single property, often after a loss has already occurred. An adjuster might use it to verify a roof's age following a hail claim, or an underwriter might check for maintenance history on a complex commercial property. This approach is property-centric, backward-looking, and fails to capture the broader context in which a property exists. Builty’s approach represents a paradigm shift. The analysis moves from the individual property to the surrounding neighborhood, and the focus shifts from historical verification to predictive analytics. This is achieved by analyzing permit data in the aggregate to detect patterns, clustering, and infrastructure shifts that are leading indicators of future risk. This method treats permit activity not as a collection of isolated documents, but as a dataset that reveals the collective behavior and stress points of a geographic area. The unique value of permit data lies in its integrity. It is not a model, a proxy, or a self-reported survey. It is direct, ground-truth evidence of physical changes to the built environment. When a permit is filed for a new electrical panel, a new HVAC system, or a new utility substation, it represents a verifiable, real-world event. This gives the resulting analytics a level of certainty and timeliness that other data sources, particularly those reliant on lagging loss history, cannot match. By pioneering this neighborhood-level intelligence, Builty reveals risks that are invisible when looking at properties in isolation. For example, a single permit for an HVAC replacement is simply noise in the data. A cluster of 50 such permits in a three-block radius within 12 months is a pattern. When that same cluster is located adjacent to a recently filed permit for a new high-capacity utility substation, the pattern becomes a clear and actionable signal of systemic grid stress. This progression - from data points to patterns, and from patterns to causal risk indicators - is the essence of modern permit intelligence.
The macro view: quantifying neighborhood transformation with the Permit Concentration Index (PCI)
To effectively manage the new risks emerging from environments like Northern Virginia, insurers first need a way to identify where the landscape is changing most rapidly. The Permit Concentration Index (PCI) is Builty’s macro-level score designed to detect precisely these external, environmental risks imposed on a portfolio by nearby industrial and commercial development. The PCI measures the concentration of such permits in and around residential zones, acting as a leading indicator for neighborhood transformation. In Loudoun County, the data center boom provides a dramatic illustration of the PCI's power. The chart below, which uses data center-related permit counts as a proxy for the PCI, visualizes the explosive growth. After a period of relative stability, the number of permits filed annually surged from approximately 50 in 2015 to 1,000 by 2025.
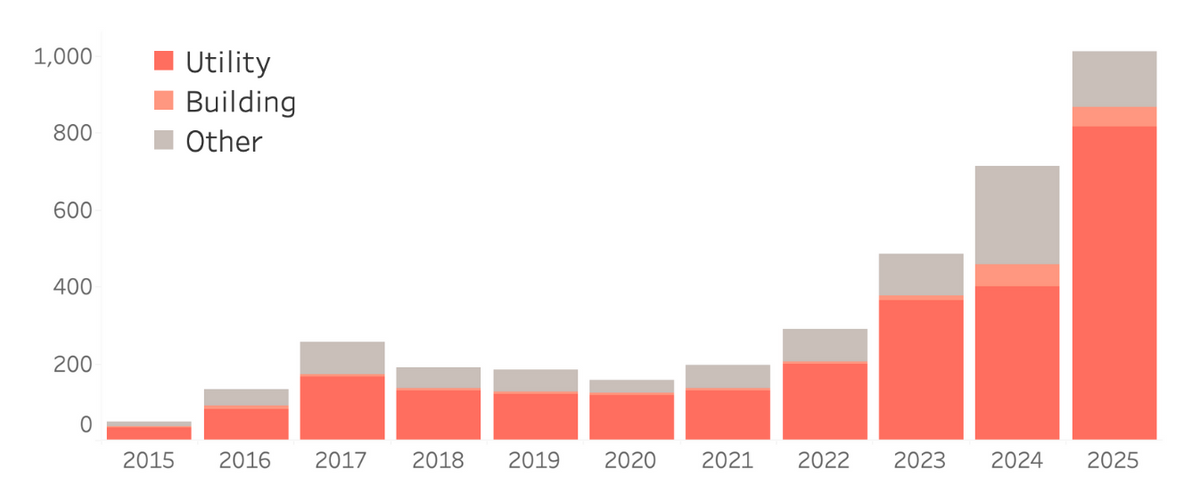 Chart 2: Loudoun County data center permits Source: Builty proprietary data This visualization tells a story of fundamental market disruption. The sheer scale of the increase is the first key takeaway. Data center-related projects jumped from representing less than 1% of all commercial projects to a projected 7.4% in 2025, signifying a dominant shift in the local construction economy. The second, more critical takeaway lies in the composition of this growth. The primary driver, represented by the teal portion of each bar, is "Utility" permits. This is a crucial distinction. The risk is not simply from new buildings; it is from the massive and complex infrastructure overhaul required to power them. This includes high-voltage electrical systems, industrial-scale mechanical equipment, and extensive plumbing networks - all of which carry a distinct and elevated risk profile compared to standard commercial construction. A surge in utility permits signals the creation of a new, interconnected power network. A failure within this network could trigger a high volume of correlated claims across a wide area, threatening portfolio stability. The PCI acts as the macro-level "canary in the coal mine." By mapping PCI scores, an insurer can instantly visualize "hotspots" where this transformation is most intense. These are the areas where underwriting assumptions must be re-evaluated and where portfolio exposure requires the closest scrutiny, years before the consequences appear in loss runs.
The micro view: translating macro stress into property-level risk scores
While the PCI identifies where risk is emerging, its effects ultimately manifest at the individual property level. Once a data center project begins, its impact cascades into a series of property-level risks that insurers must price and manage. Builty has developed a suite of micro-level scores to detect these specific signals of distress, aging, and regulatory friction.
The distress signal: Neighborhood Modernization Index (NMI)
The Neighborhood Modernization Index (NMI) measures the rate of recent system upgrades - such as HVAC and electrical panels - within a given area. Under normal circumstances, a high NMI is a positive signal, indicating homeowner investment and well-maintained properties. However, when correlated with proximity to data centers, the NMI becomes a powerful distress signal. It no longer reflects proactive improvement but rather forced, reactive replacements driven by external grid stress that pushes aging residential systems past their breaking point. To isolate this effect, a comparison was conducted between two demographically similar Loudoun County zip codes. Zip code 20147, a "test" area, contains over 100 data centers. Zip code 20152, a "control" area, contains only 13. An analysis of residential HVAC replacement permits over a 10-year period, adjusted per 1,000 housing units, shows a clear and persistent pattern. Table 1: Residential HVAC replacement permit comparison
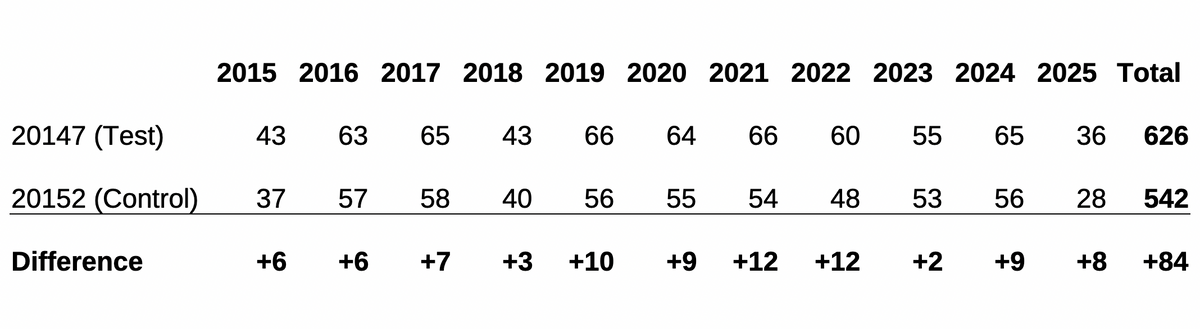 The data reveals three critical findings. First, the cumulative impact is significant. Over the decade, the data-center-dense area saw 83 additional HVAC replacements - an 18% higher rate - representing a tangible increase in claims exposure. Second, this is a long-term trend, not a recent anomaly. The sustained higher rate of replacements supports a "death by a thousand cuts" hypothesis, where cumulative grid stress has consistently shortened the lifespan of these systems. Third, the signal is accelerating. The annual difference widened notably in 2021 and 2022, coinciding with the most intense period of data center construction, indicating that the risk is escalating. The NMI thus provides a direct measure of accelerated asset depreciation, allowing insurers to identify in real-time where core underwriting assumptions about the useful life of property systems are no longer valid.
The latent threat: Permit Silence Score (PSS)
The Permit Silence Score (PSS) identifies the inverse risk by first applying a binary flag to each individual property that has not had a major permit filed in 15 years or more. To create a geographic risk metric, these individual flags are then aggregated at the zip code level and calculated as a percentage of the total housing units in that area. This score pinpoints concentrations of latent risk from aging infrastructure, with outdated systems that are highly vulnerable to failure, especially when subjected to new external stresses.
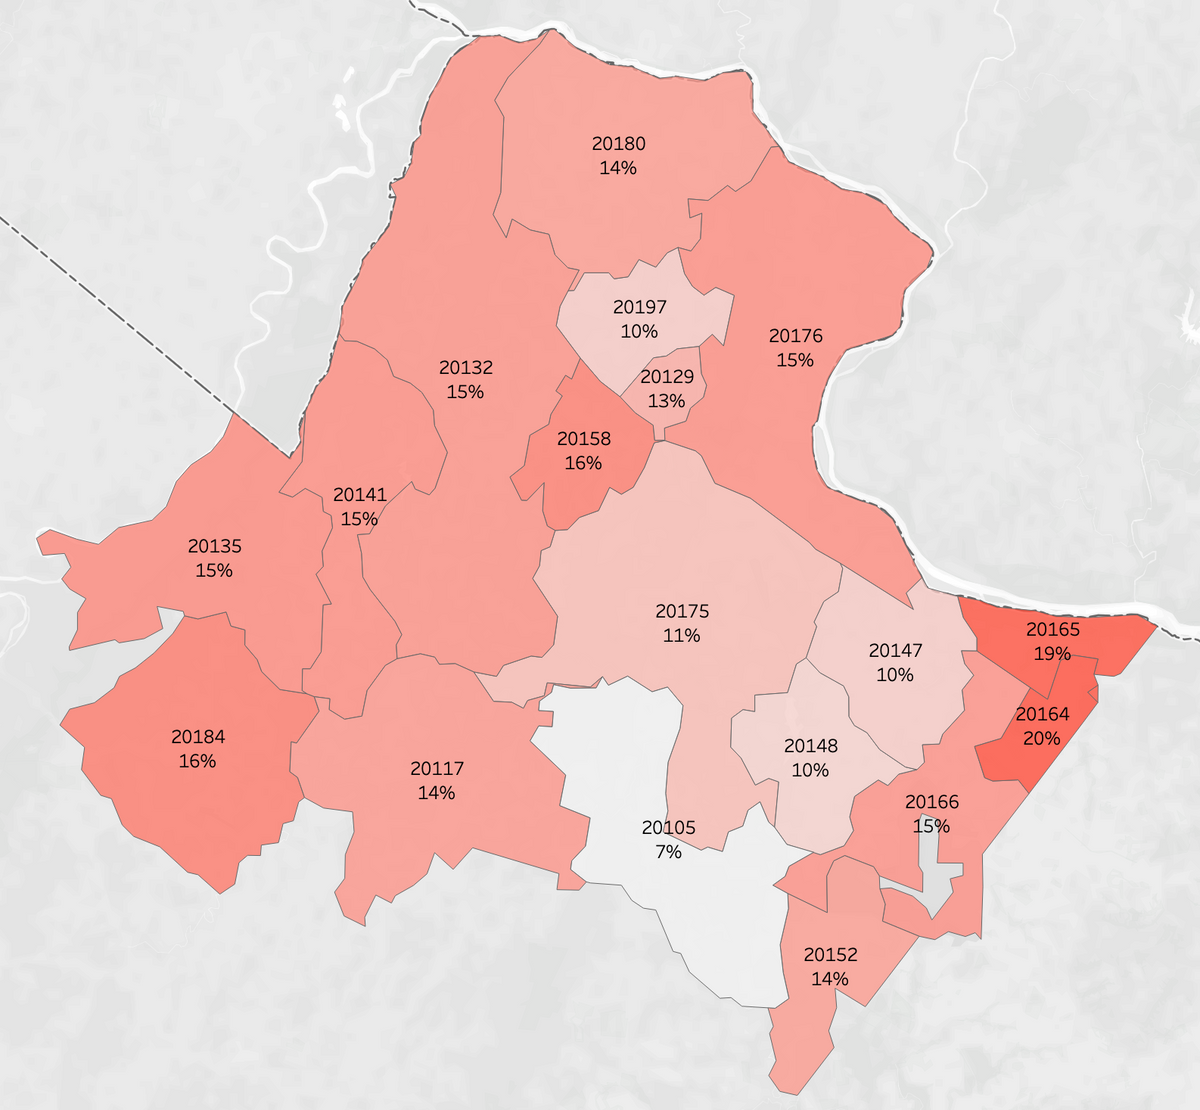 Chart 3: Loudoun County PSS A map of PSS scores in Loudoun County reveals that even in this highly active real estate market, significant pockets of deferred maintenance exist. Scores range from as low as 7% to as high as 20% in certain zip codes. A 20% PSS means that one in five properties in that area has a potentially antiquated electrical, plumbing, or HVAC system. For an insurer, this identifies a "ticking time bomb" portfolio where the risk of catastrophic system failure is highly concentrated. While the map illustrates the geographic concentration of this risk, the following chart quantifies the sheer volume of properties that fall into these aging categories.
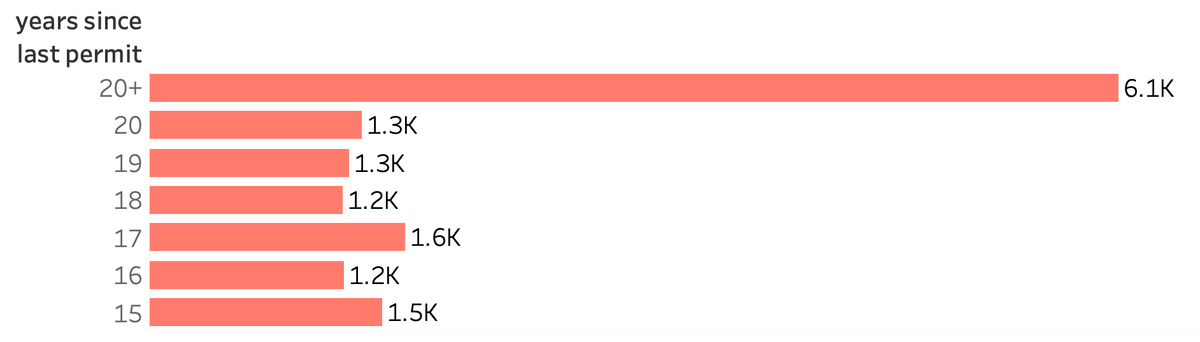 Chart 4: Loudoun County properties without permits This distribution highlights two critical takeaways for underwriters:
- A massive pool of latent risk: The data shows a total of more than 14,000 properties have gone without a single permit for 15 years or more.
- A severe long-tail problem: Most alarmingly, over 6,100 of these properties - the largest single group by far - have not had any permitted work in over two decades. These properties represent the highest tier of unpriced risk, with systems that are far more likely to fail under the strain of a modernizing power grid. The combination of a high PSS (aging systems) and a high PCI (new infrastructure stress) creates a compound risk that is far greater than the sum of its parts. An old, brittle electrical panel is a known hazard. When that panel is subjected to the fluctuating, "dirty" power common in a grid under strain, the probability of an electrical fire increases exponentially. The PSS allows an underwriter to screen for this dangerous combination, identifying properties where an aging system is about to be pushed past its breaking point.
The regulatory gap: Open Permit Risk (OPR)
The Open Permit Risk (OPR) score begins at the property level, where a binary flag is assigned to any property with a permit that has remained open for more than 365 days. The zip-code level OPR score is then calculated by expressing the total count of these flagged properties as a percentage of the total housing units within that zip code. This aggregated score serves as a powerful proxy for regulatory risk, signaling jurisdictions with significant inspection backlogs, poor record-keeping, or lax enforcement of building codes.
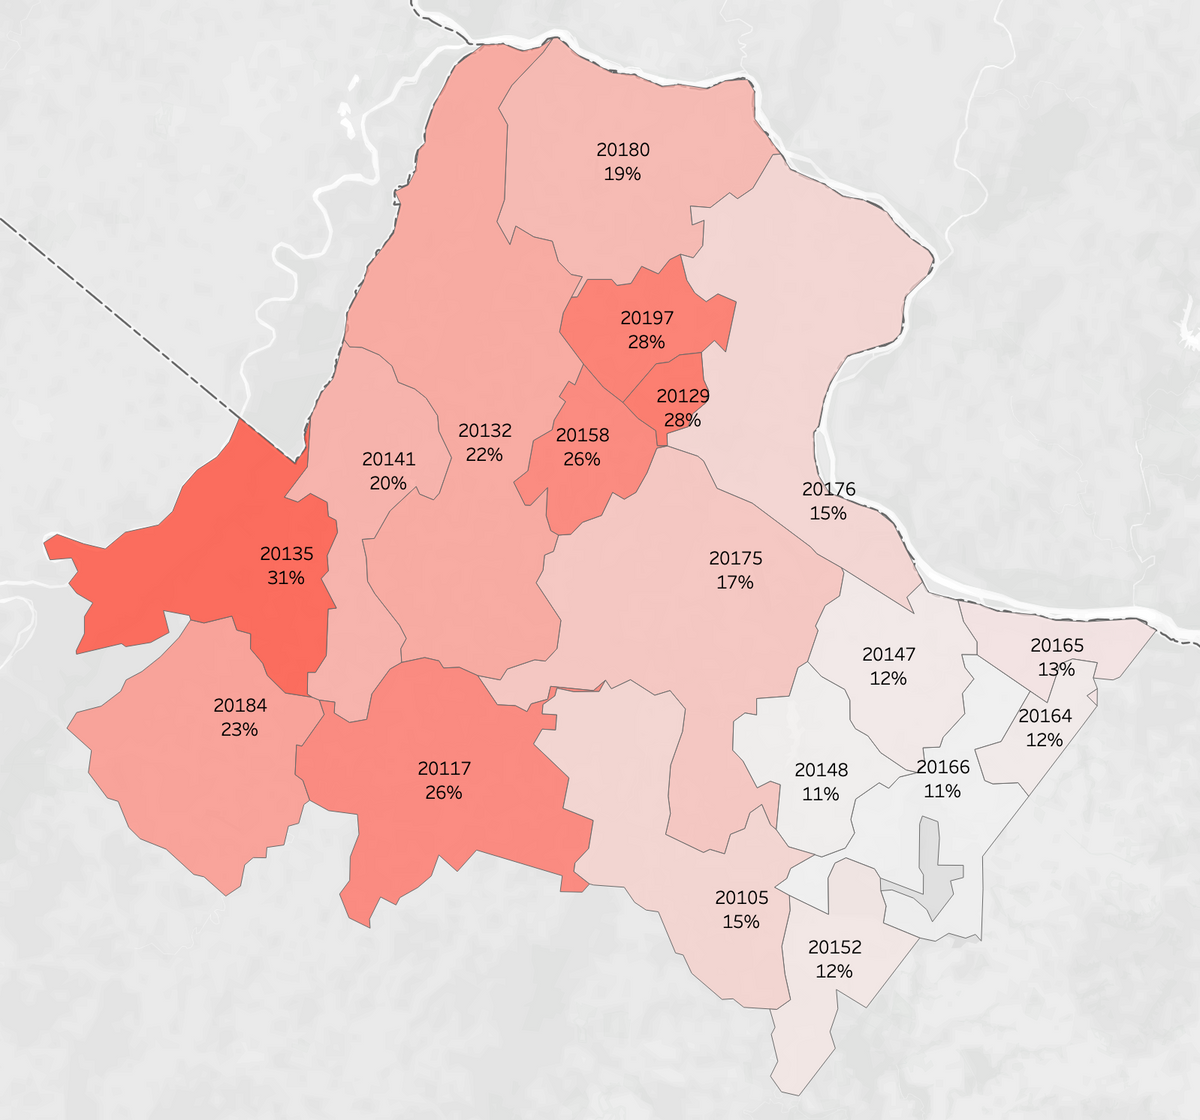 Chart 5: Loudoun County OPR In Loudoun County, OPR scores are highest in the western, more rural areas, suggesting potential gaps in municipal oversight. For an insurer, a high OPR score is a critical red flag. It indicates that they may be covering a property that is not fully code-compliant and has not received a final, official sign-off from local authorities. This creates a hidden liability. A claim on a property with a long-open permit for a new electrical system, for instance, becomes far more complex to investigate and adjust. The OPR score helps underwriting and claims departments proactively identify areas where they can expect higher claims complexity, potential fraud, and increased moral hazard.
Actionable intelligence for insurers: key takeaways
The evidence from Northern Virginia's data center boom provides a clear and compelling case for the adoption of permit-based risk analytics. The strategic implications for underwriting, claims, and portfolio management are immediate and profound:
- Permits are definitive leading indicators of loss exposure, not lagging administrative records. They provide ground-truth signals of changing risk years before that risk emerges in traditional loss data.
- The unprecedented data center growth in Virginia serves as a live, real-world testbed for deploying and validating permit-based analytics. The lessons learned here are directly applicable to other areas experiencing rapid industrial or commercial development.
- Builty's risk scores can be piloted and deployed now, providing immediate risk insight. Insurers do not need to wait years for new loss data to mature to begin making more informed decisions. The scores detailed in this report represent just a fraction of the analytical capabilities available. Builty has developed more than 30 proprietary risk scores that address a wide spectrum of property risks. For example, insurers can leverage scores such as the Catastrophe Resilience Score to assess vulnerability to natural disasters, the Roof Attention Index to flag properties with potential roof-related issues, the Unpermitted Activity Signal to identify non-compliant construction, the System Distress Signal to detect failing electrical or mechanical systems, and the Portfolio Resilience Index to evaluate risk concentration across an entire book of business.
Deploying permit intelligence: a call to action
The opportunity to gain a competitive advantage through permit intelligence is not a future prospect; it is an immediate reality. The Virginia dataset highlighted in this report is clean, validated, and production-ready, removing the friction and long implementation timelines often associated with new data sources. Builty can deliver pilot scores for a Virginia-based portfolio within weeks, allowing claims and underwriting teams to quickly assess the impact of this new intelligence on their book of business. We invite insurance leaders to move beyond lagging indicators and embrace the predictive power of permit data. Let’s talk!


